Build a Consistency Dashboard That Shows the Full Picture
If you want more than a streak counter, Three Cells helps you connect habits, daily reflections, and metrics in one consistency dashboard.
People who want a visual dashboard for habits and routines, especially if simple checklists never show why consistency rises or falls.
Why Most Consistency Tracking Feels Incomplete
A streak alone shows what happened. It rarely shows why the pattern held, where it started slipping, or how to fix it.
Your current tracker shows streaks, but not the context that explains why consistency changes.
The data you need for review lives across notes, task apps, and habit tools that never line up.
You only notice drift after several bad days because there is no single dashboard to review.
A Dashboard With Context, Not Just Checkmarks
Three Cells combines habit streaks, short journal notes, and daily priorities so your dashboard reflects the system behind the outcome.
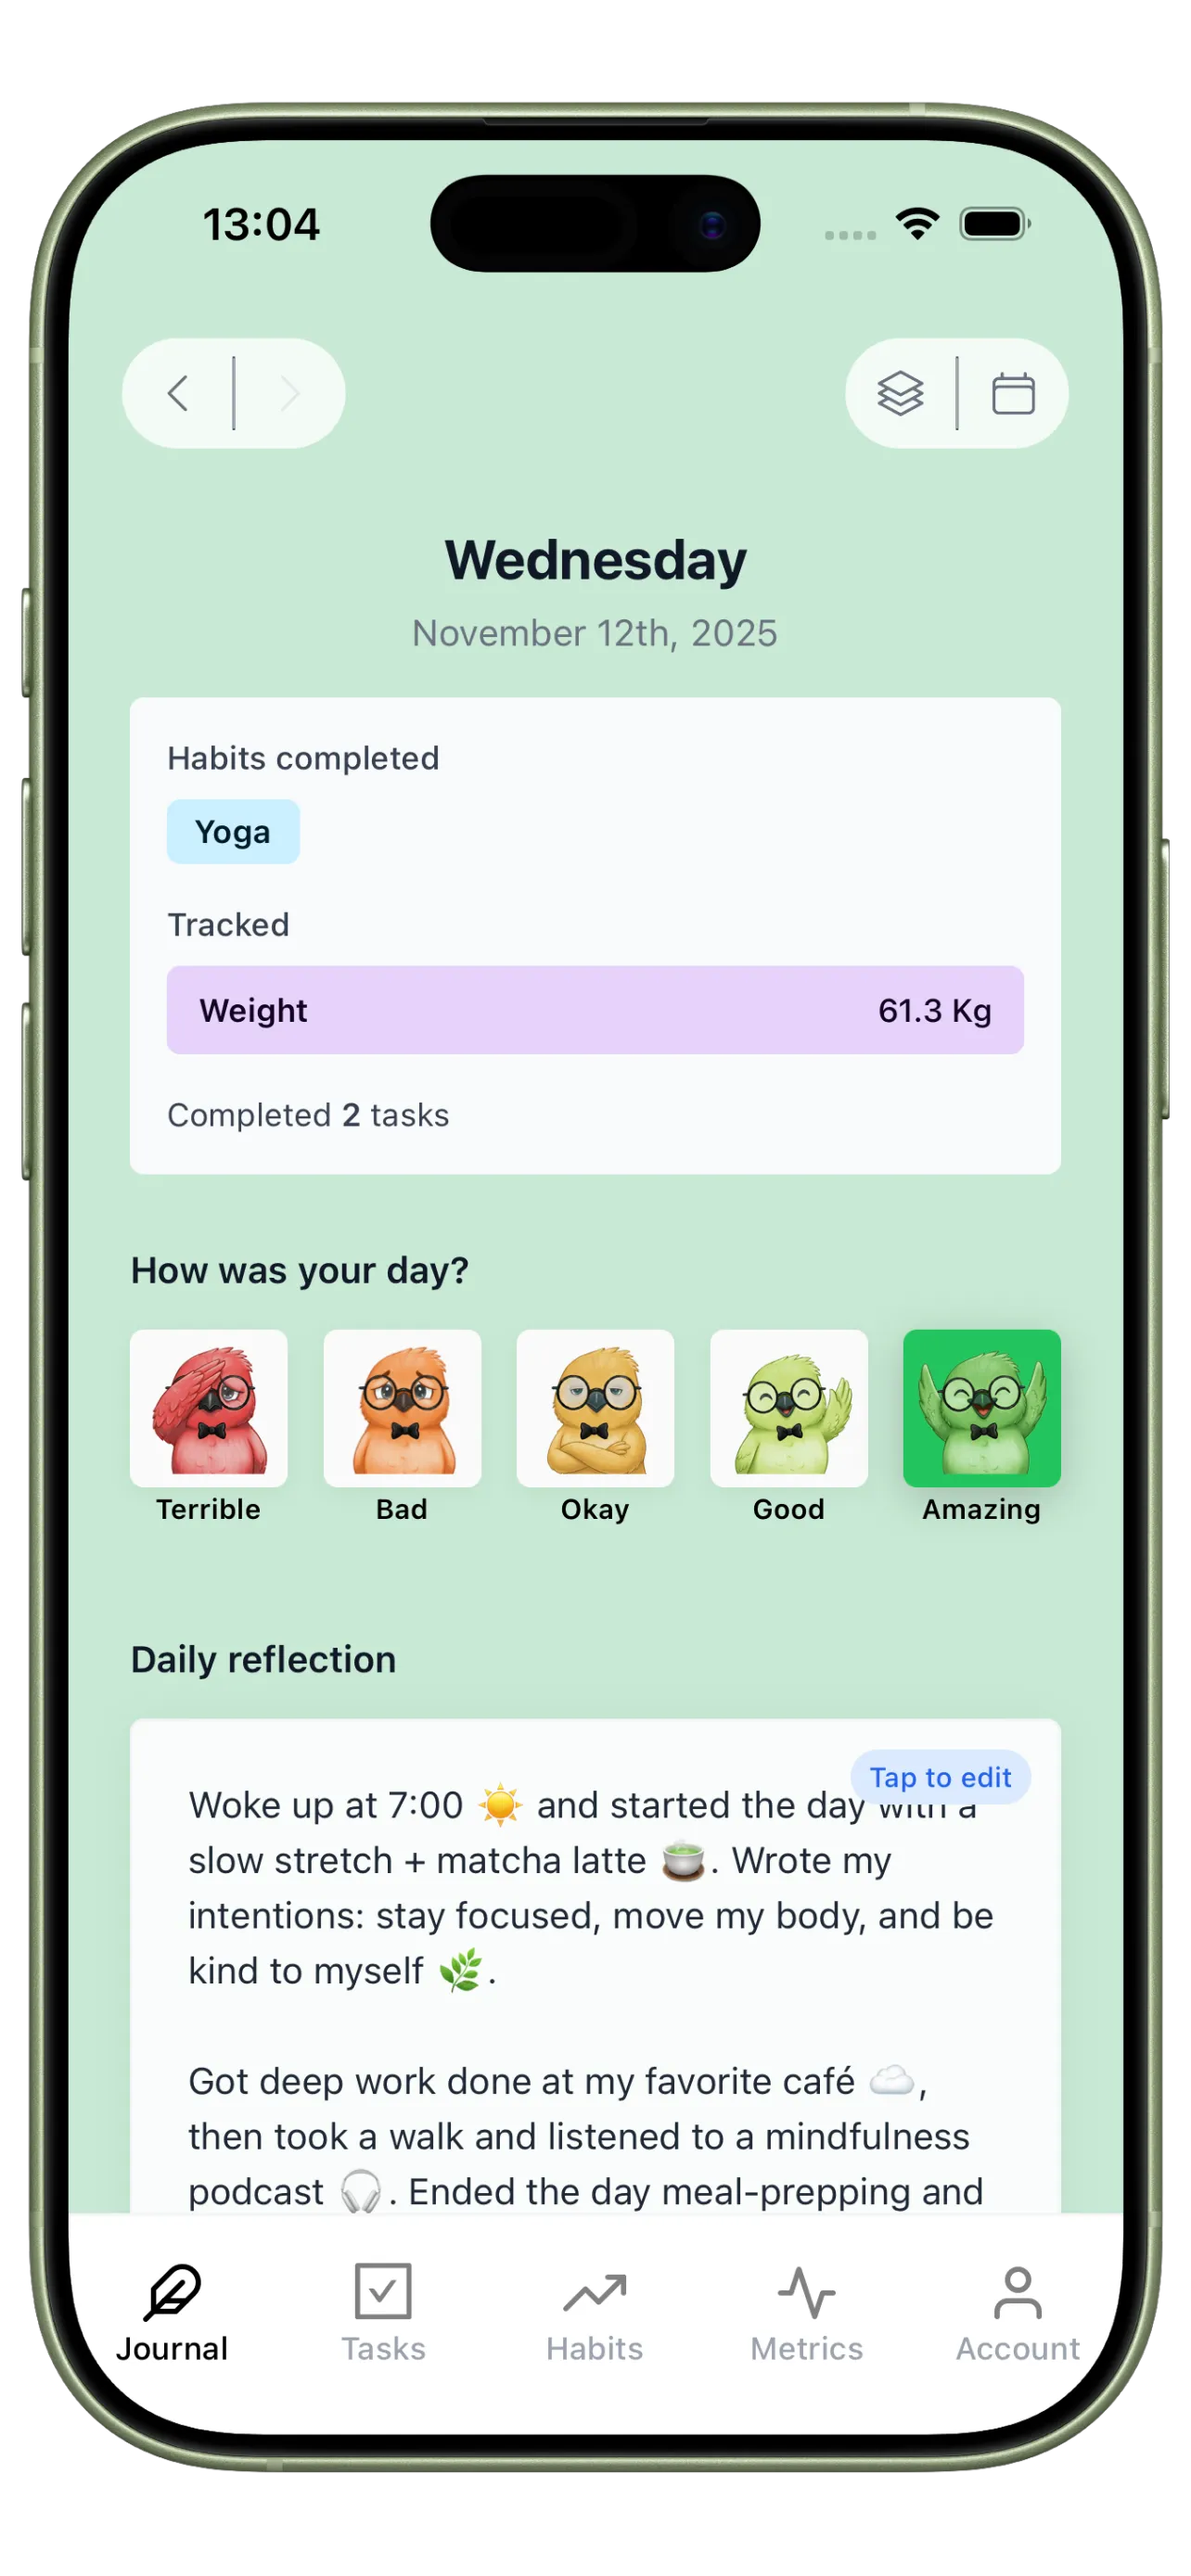
Daily Pattern Journal
Use Journal to capture the daily context that turns your dashboard from a streak counter into an explanation engine.
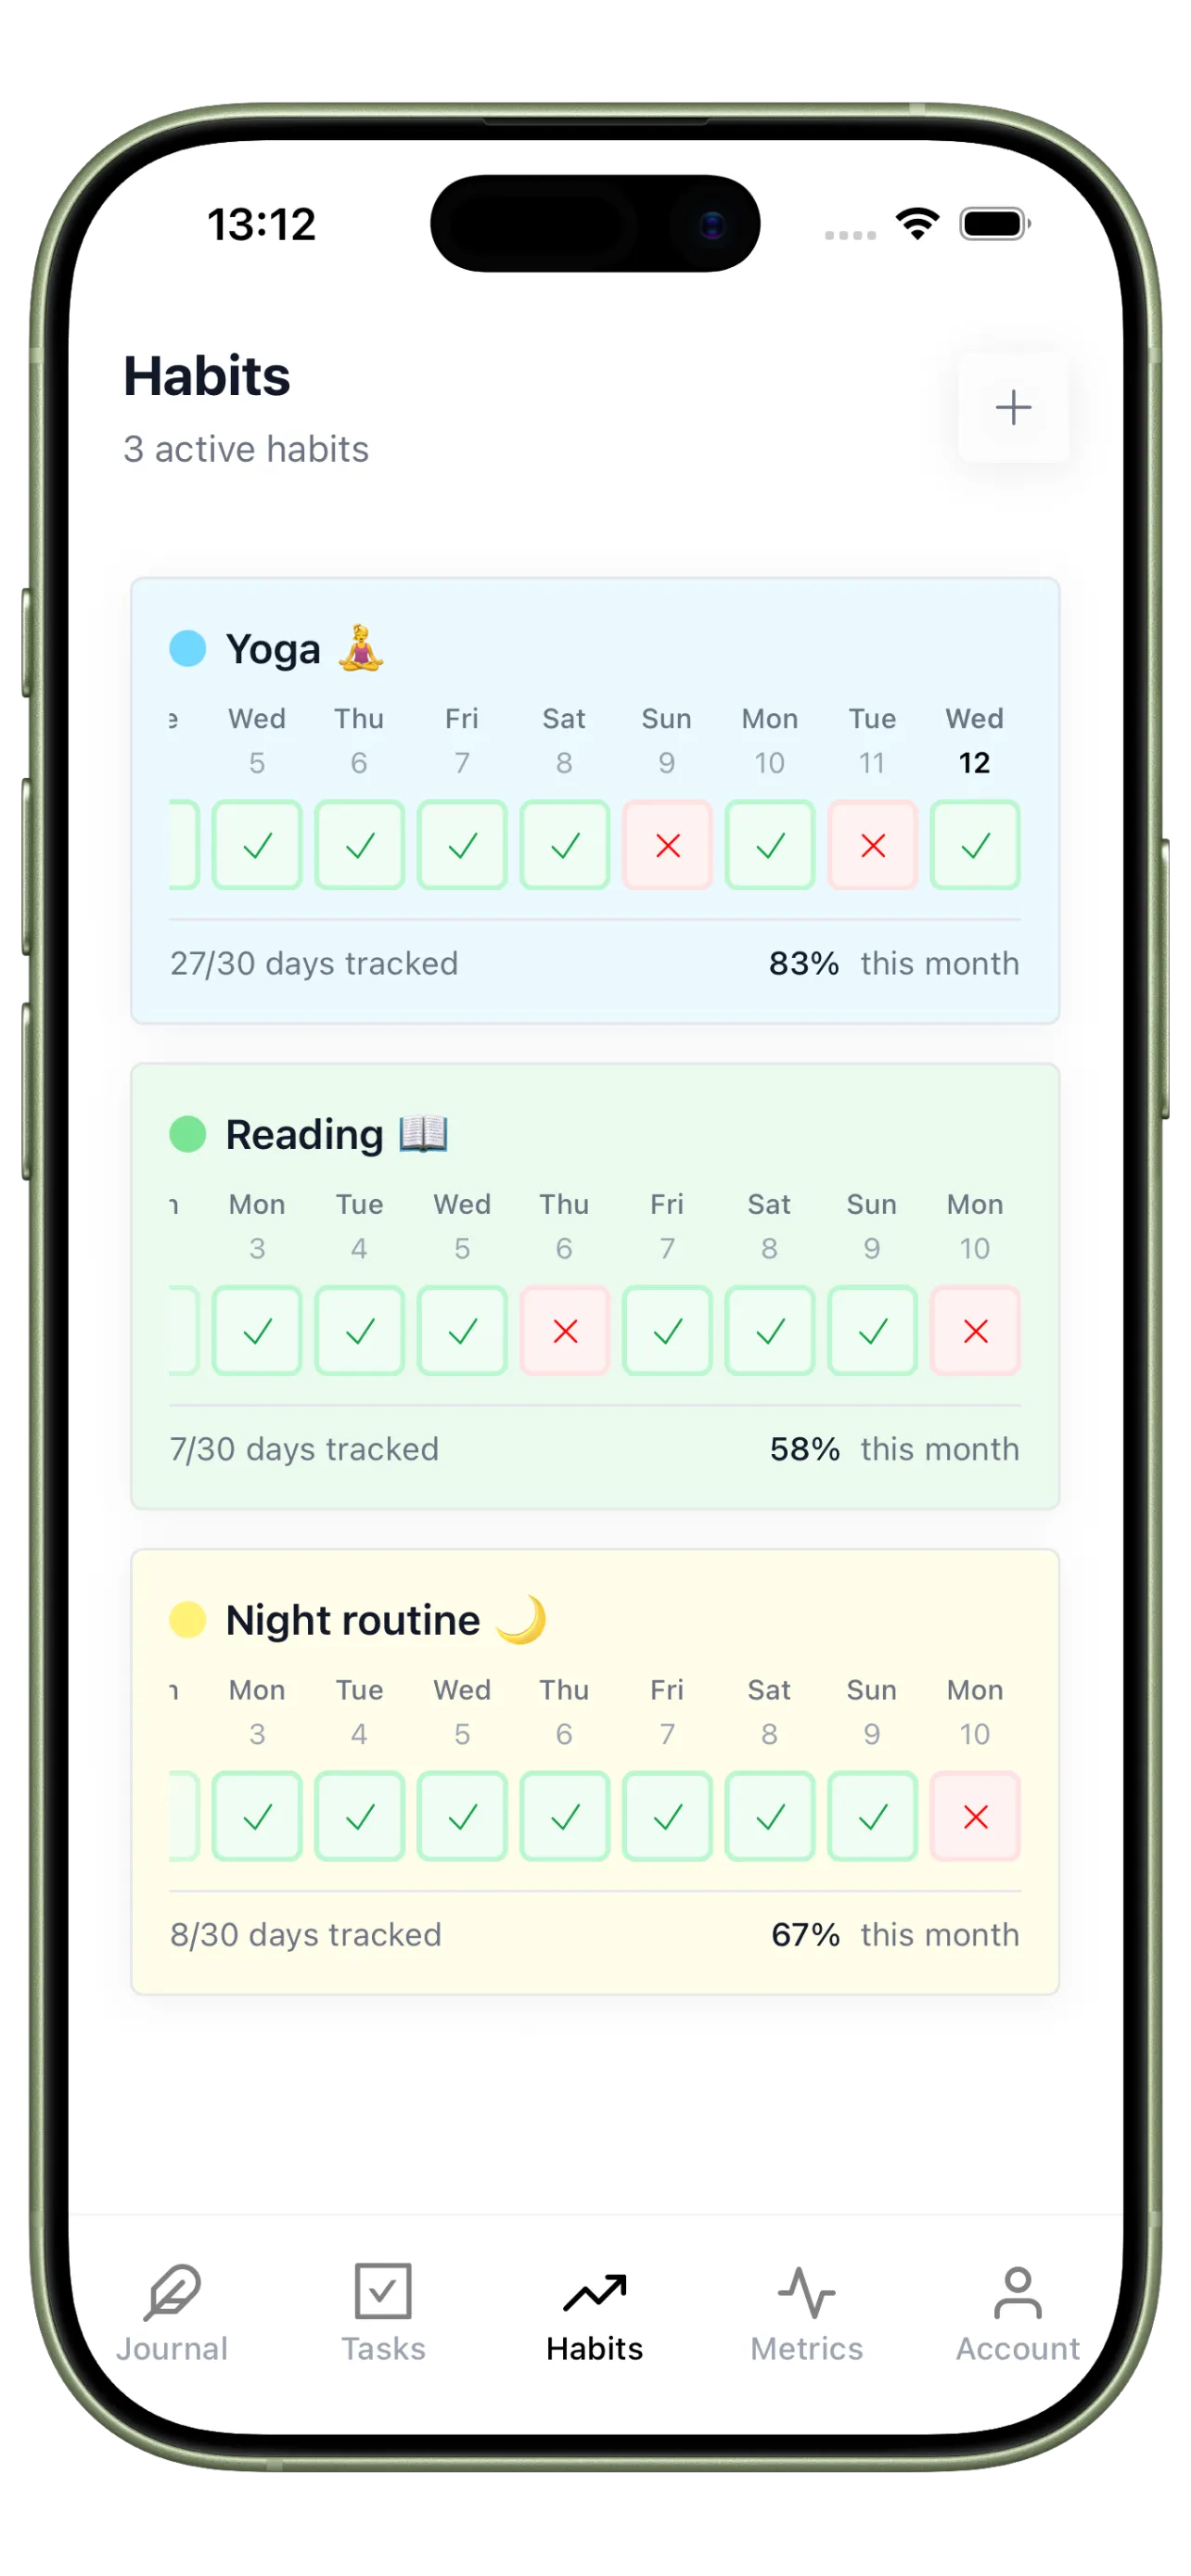
Streak Dashboard
Use Habits to keep the repeatable behaviors visible and easy to review across days, weeks, and months.
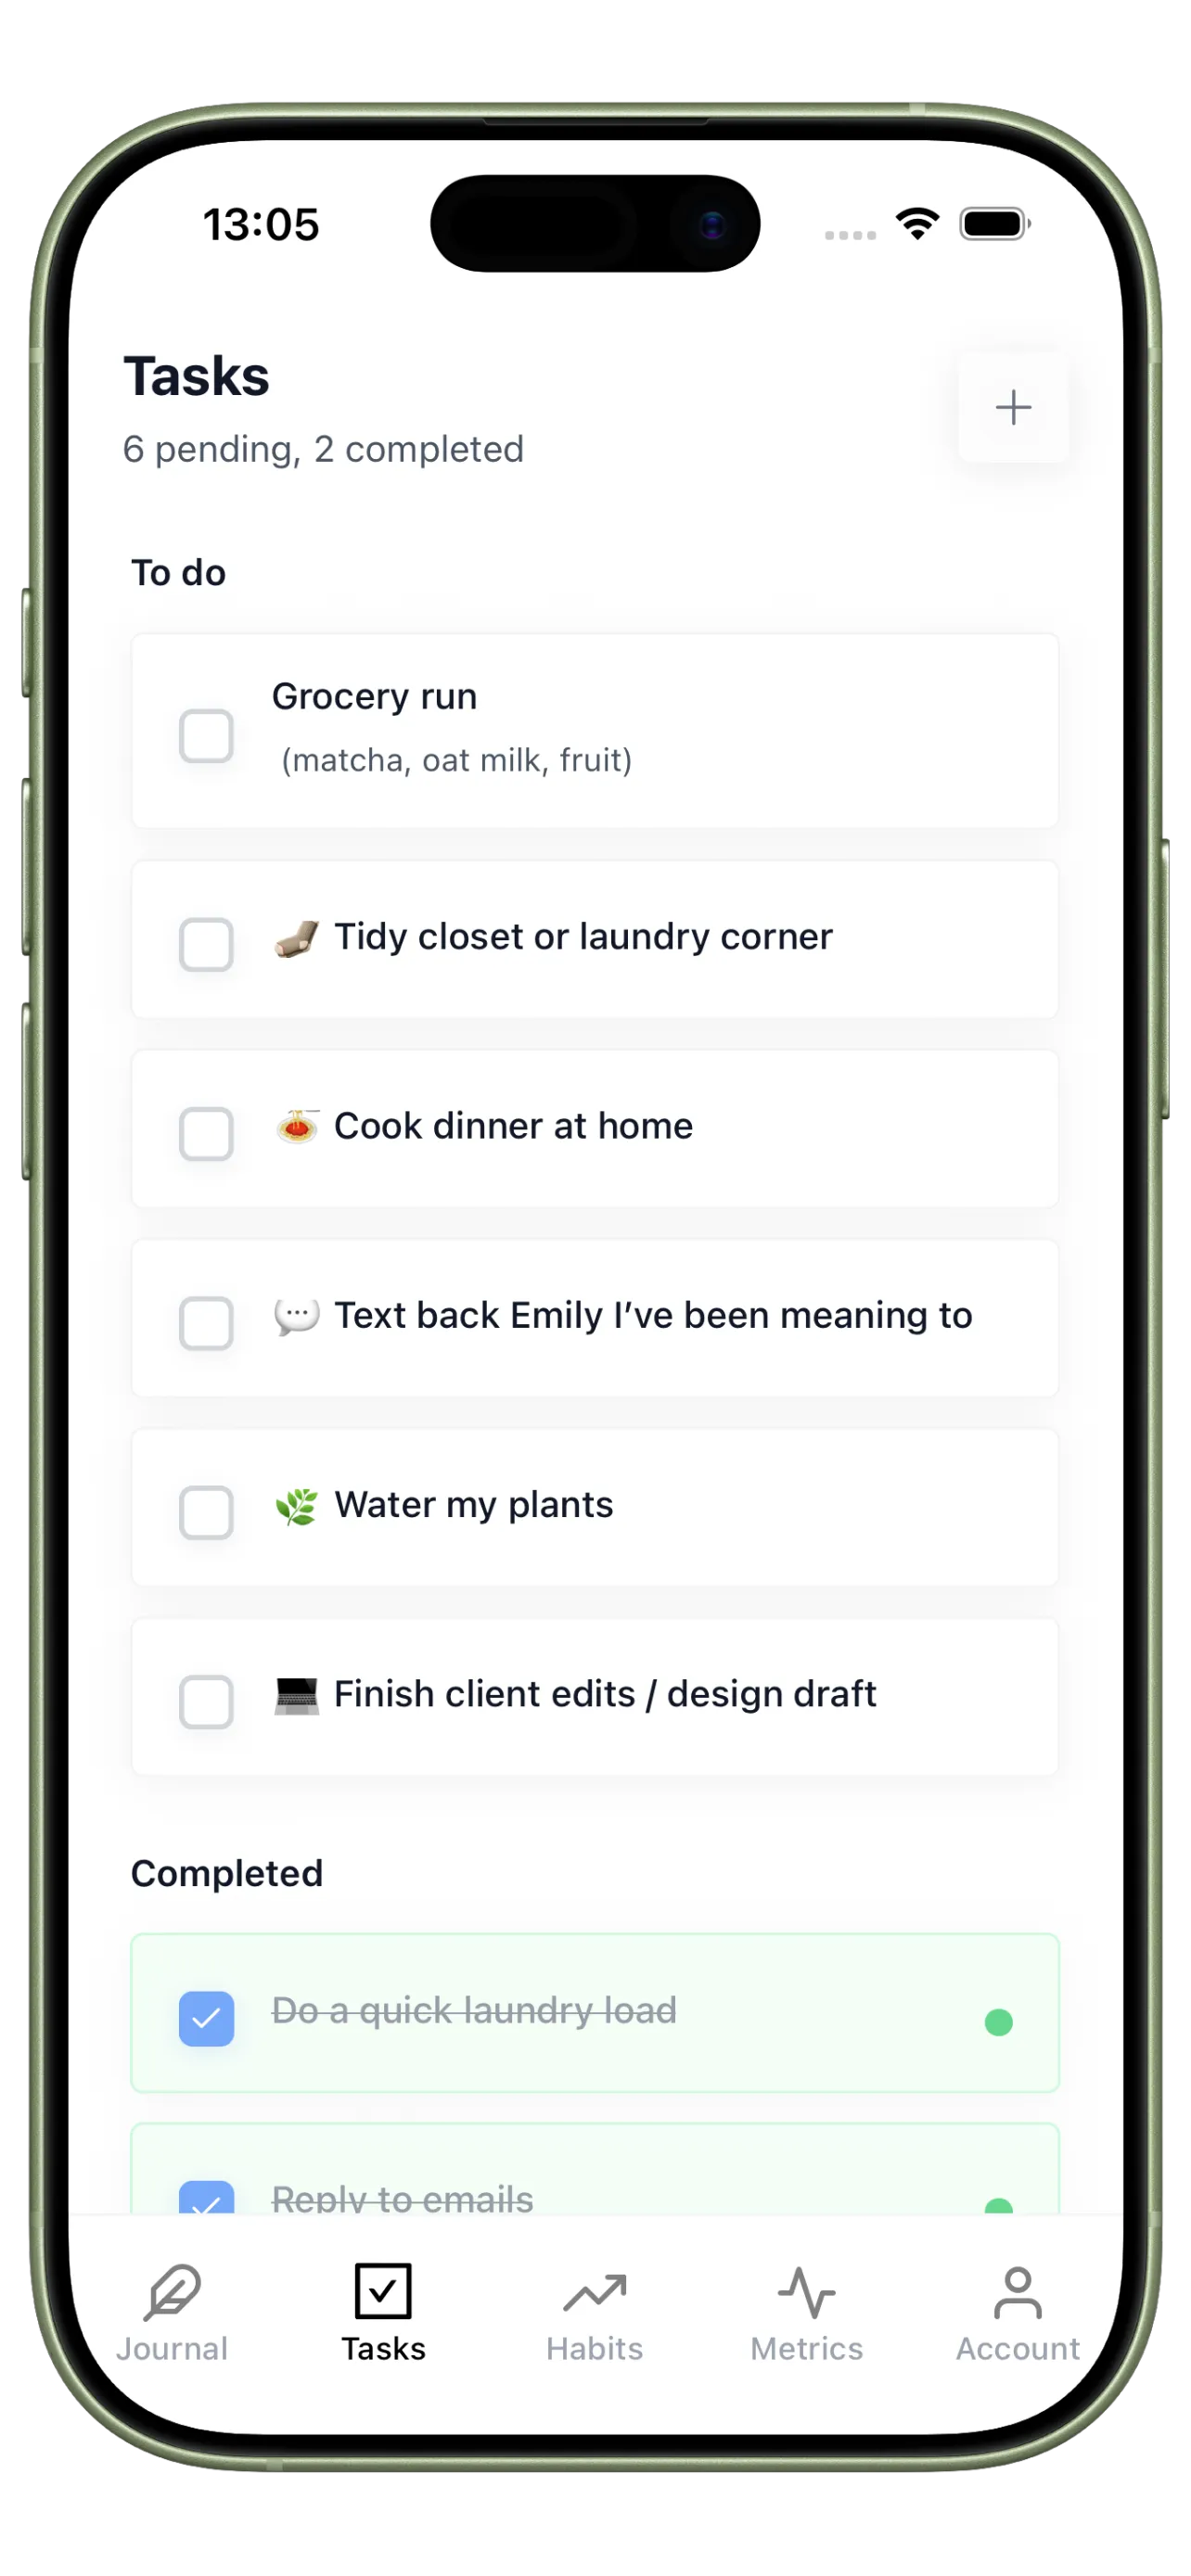
Priority Support Tasks
Use Tasks for the one-off actions that support consistency, like prepping your environment or fixing a broken routine.
Your 4-Step Consistency Dashboard Setup
Build a dashboard that makes review faster, clearer, and more useful than a list of checkboxes.
Step 1
Choose a small set of anchor habits
Track only the repeated behaviors that best predict whether your day stays on track.
Step 2
Add one sentence of daily context
Write a short note on energy, stress, or disruption so the dashboard explains the pattern, not just the outcome.
Step 3
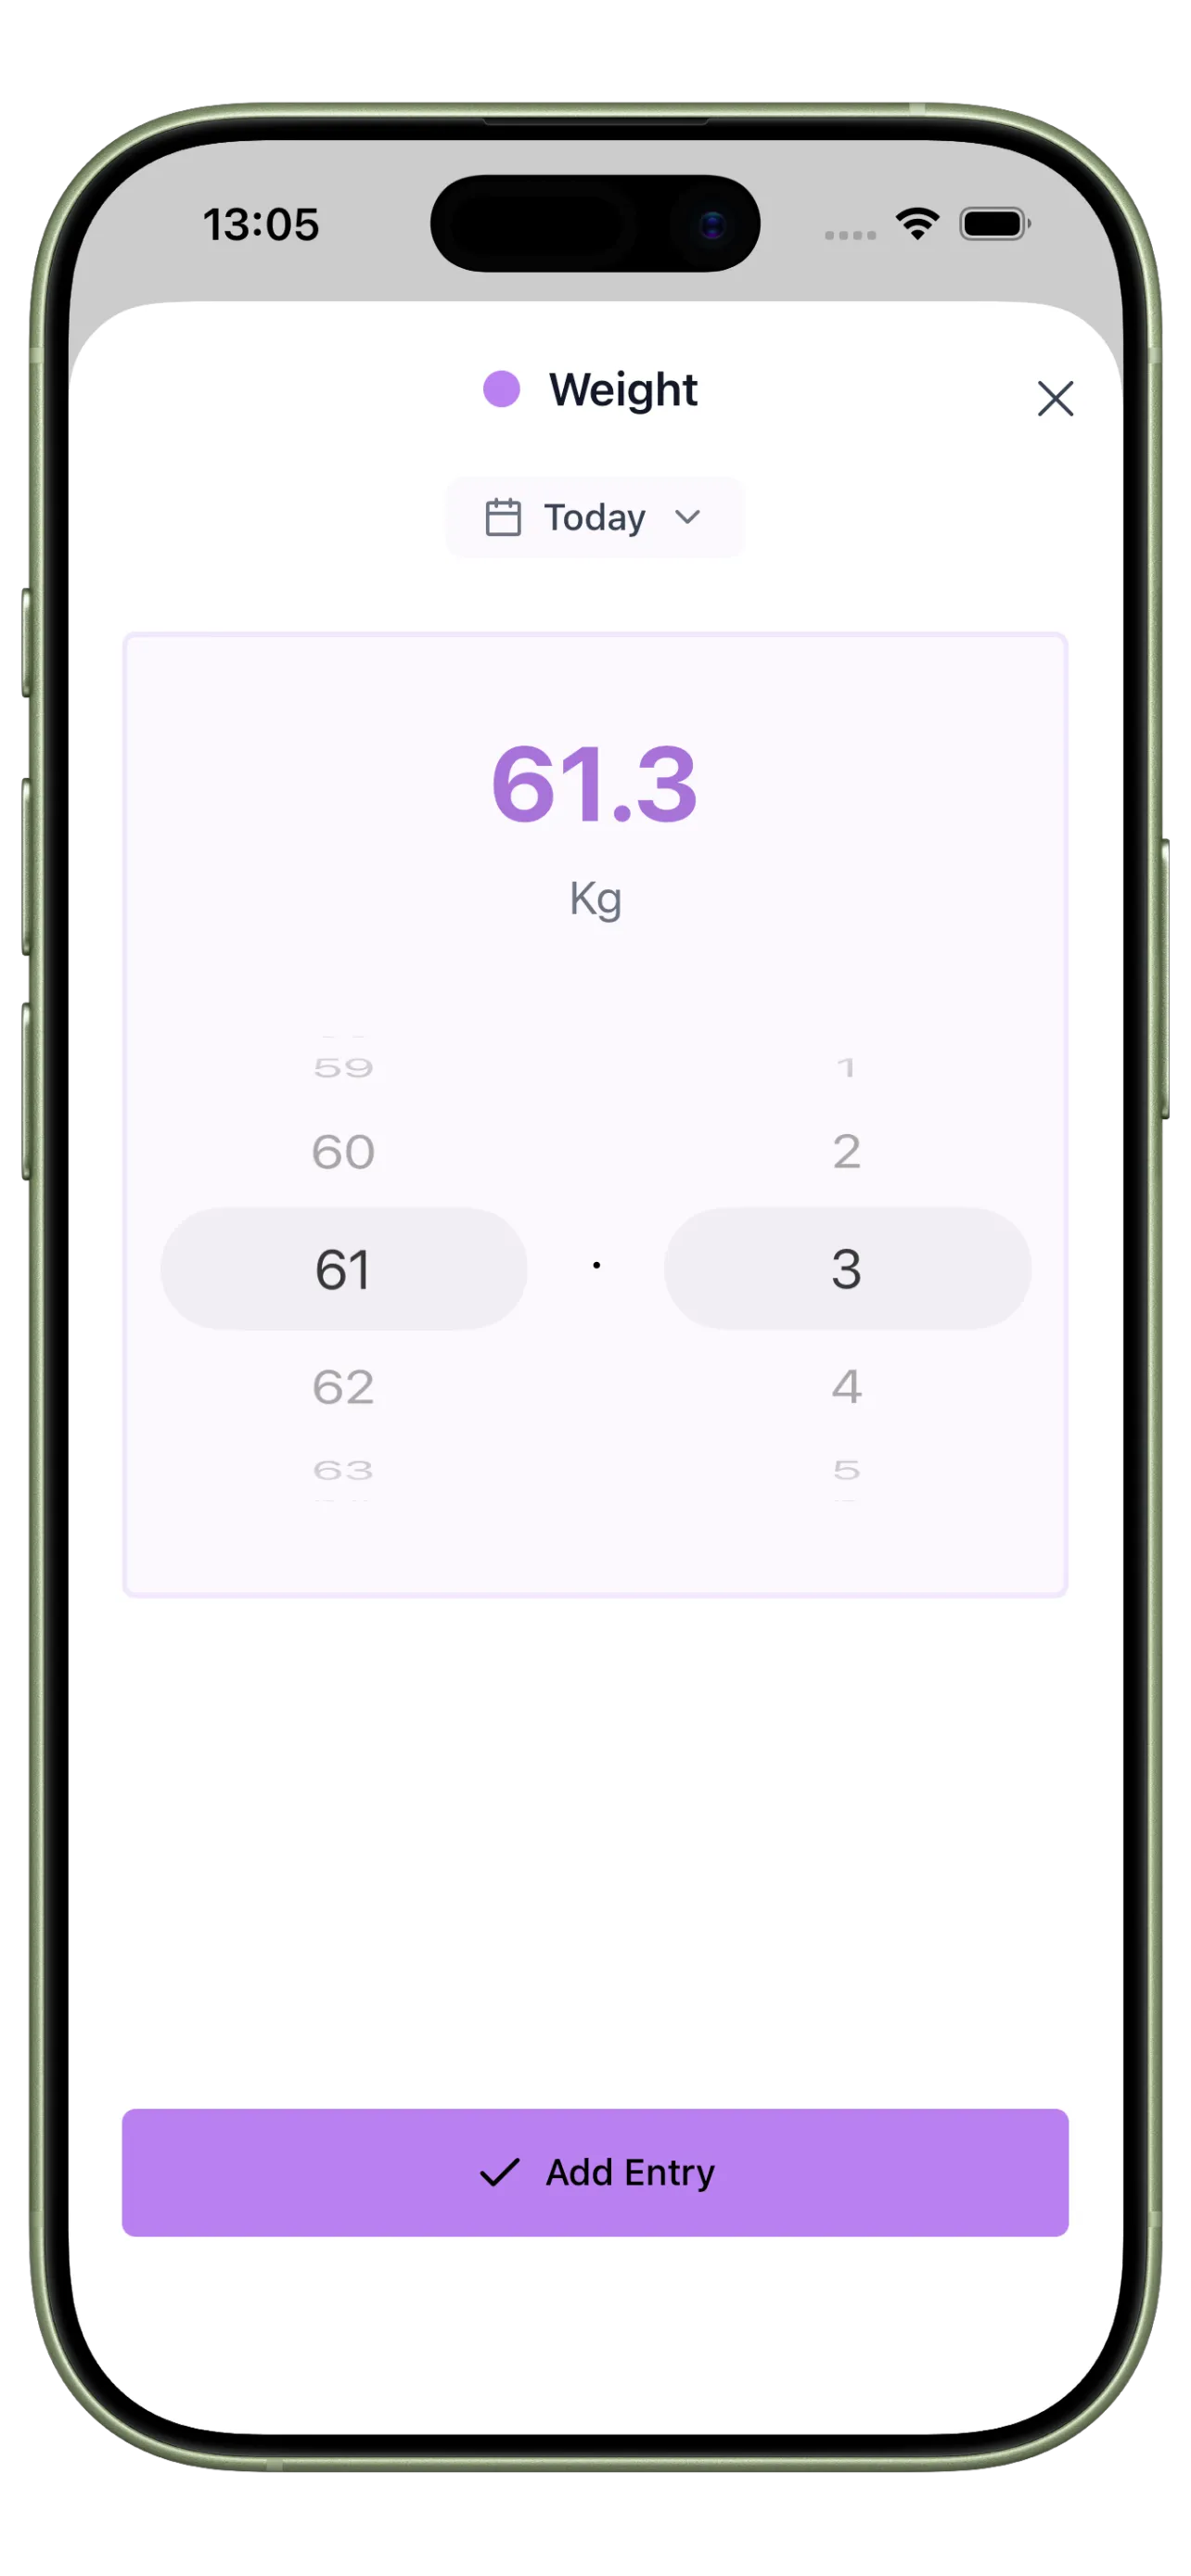
Track one supporting metric
Use a simple number like focus sessions or sleep hours to connect routine quality with results.
Step 4
Review the dashboard weekly
Look for clusters, not isolated misses. The goal is to improve the system that drives consistency.
See Patterns Before They Turn Into Drift
Use timeline logs, trend metrics, and heatmaps to catch weak spots early and protect your routines.
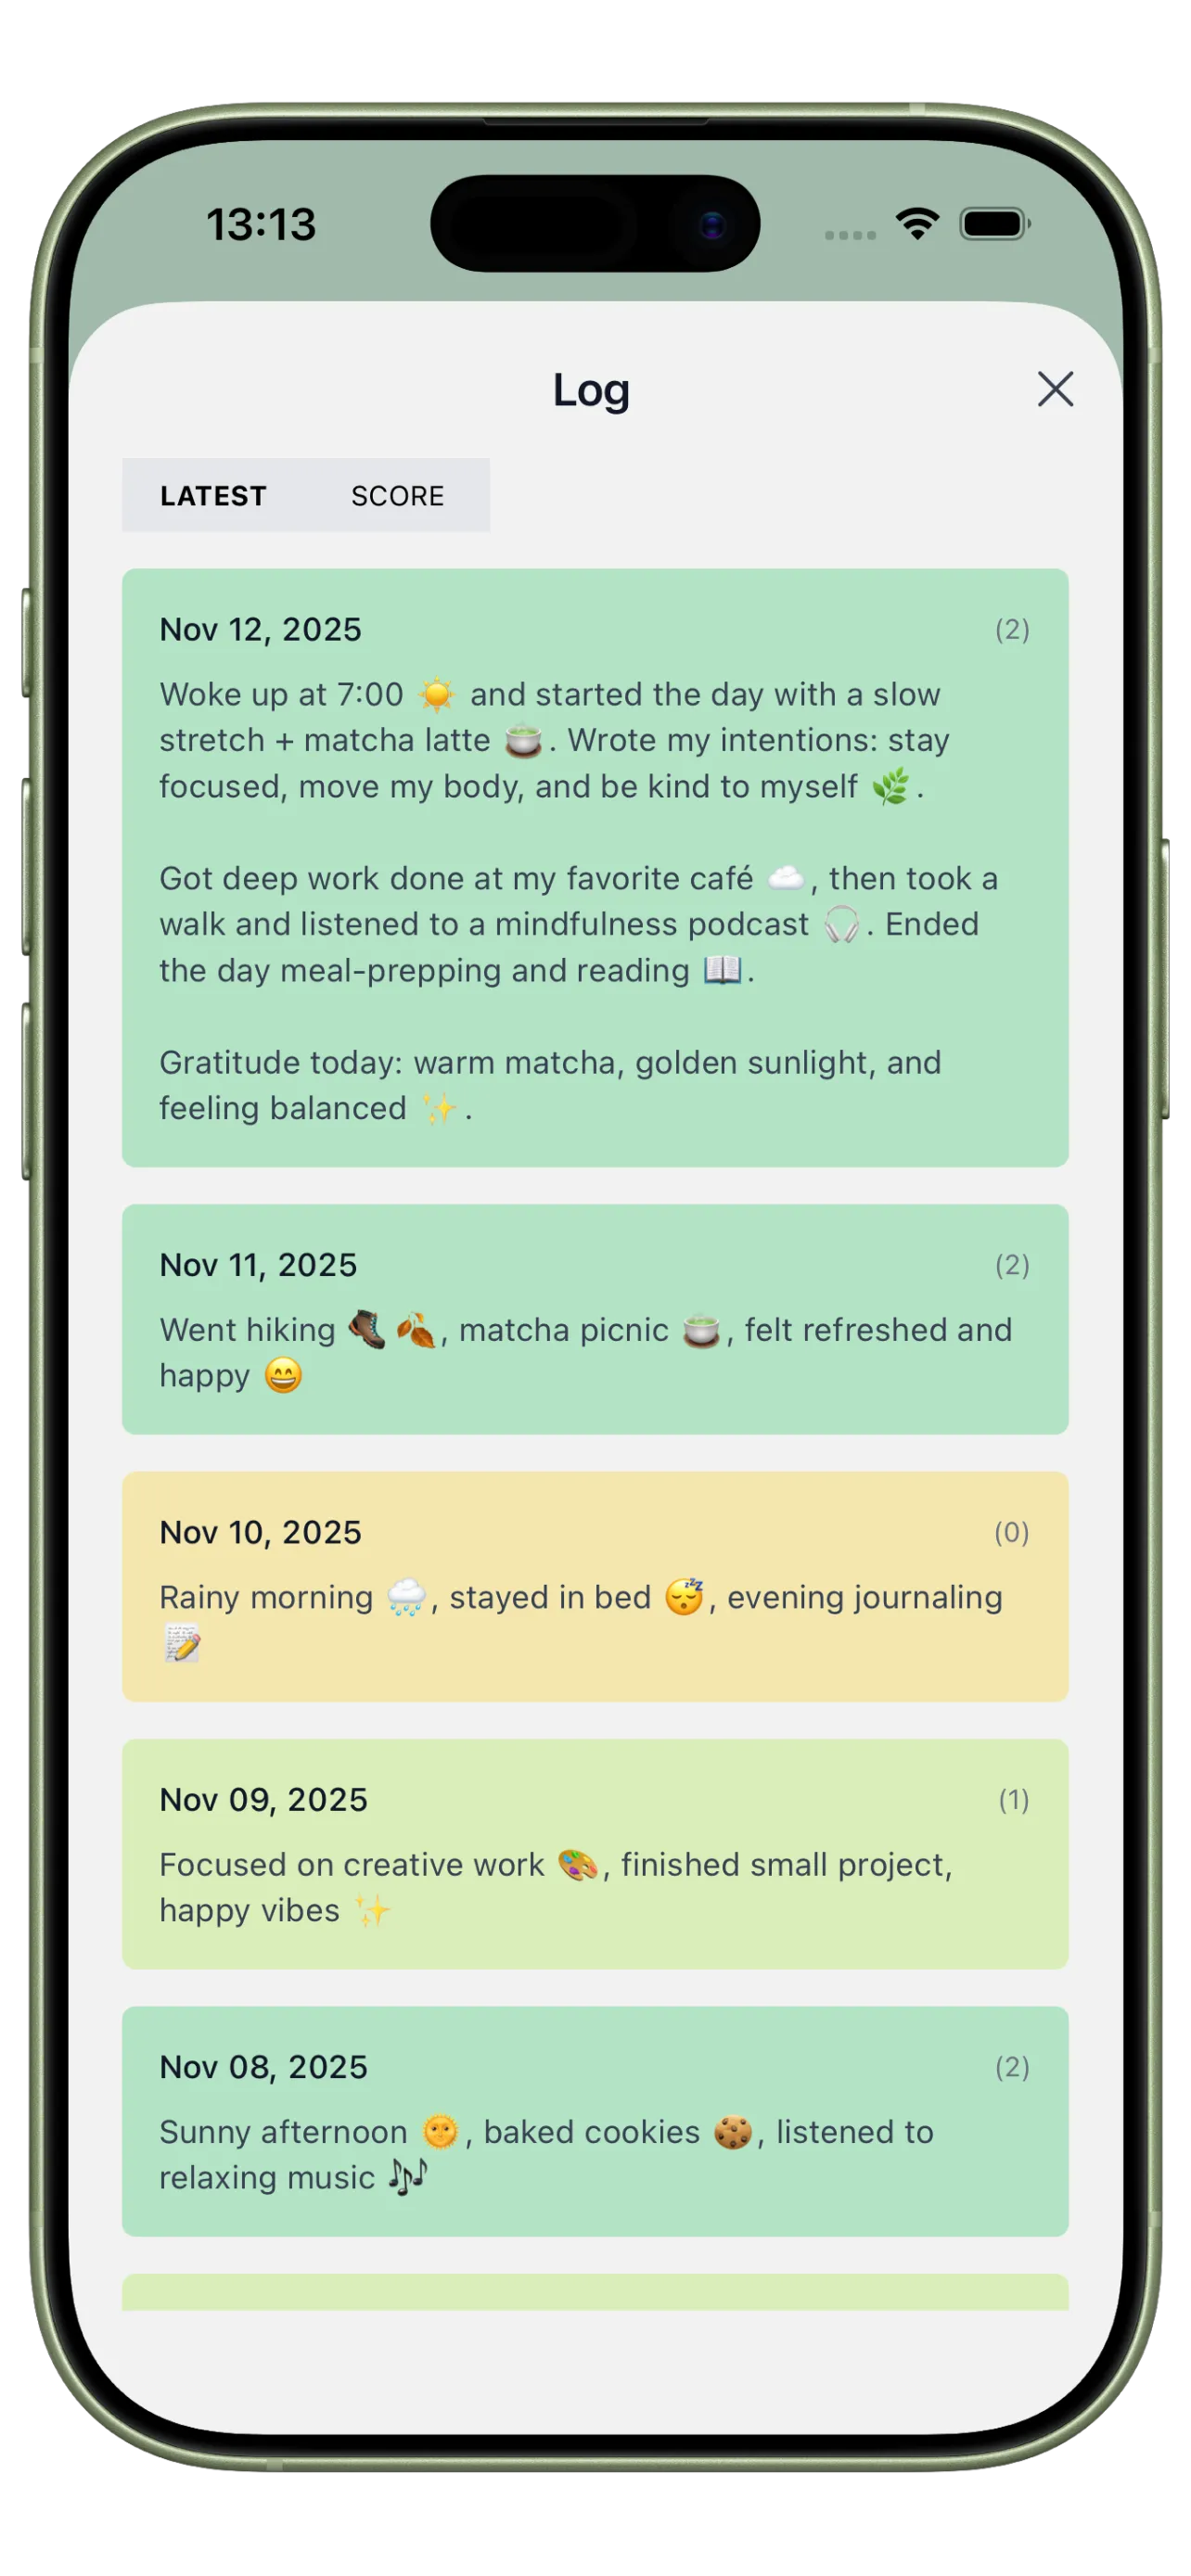
Consistency Timeline
Review your day as a sequence, not just a score, so repeated friction points become visible.
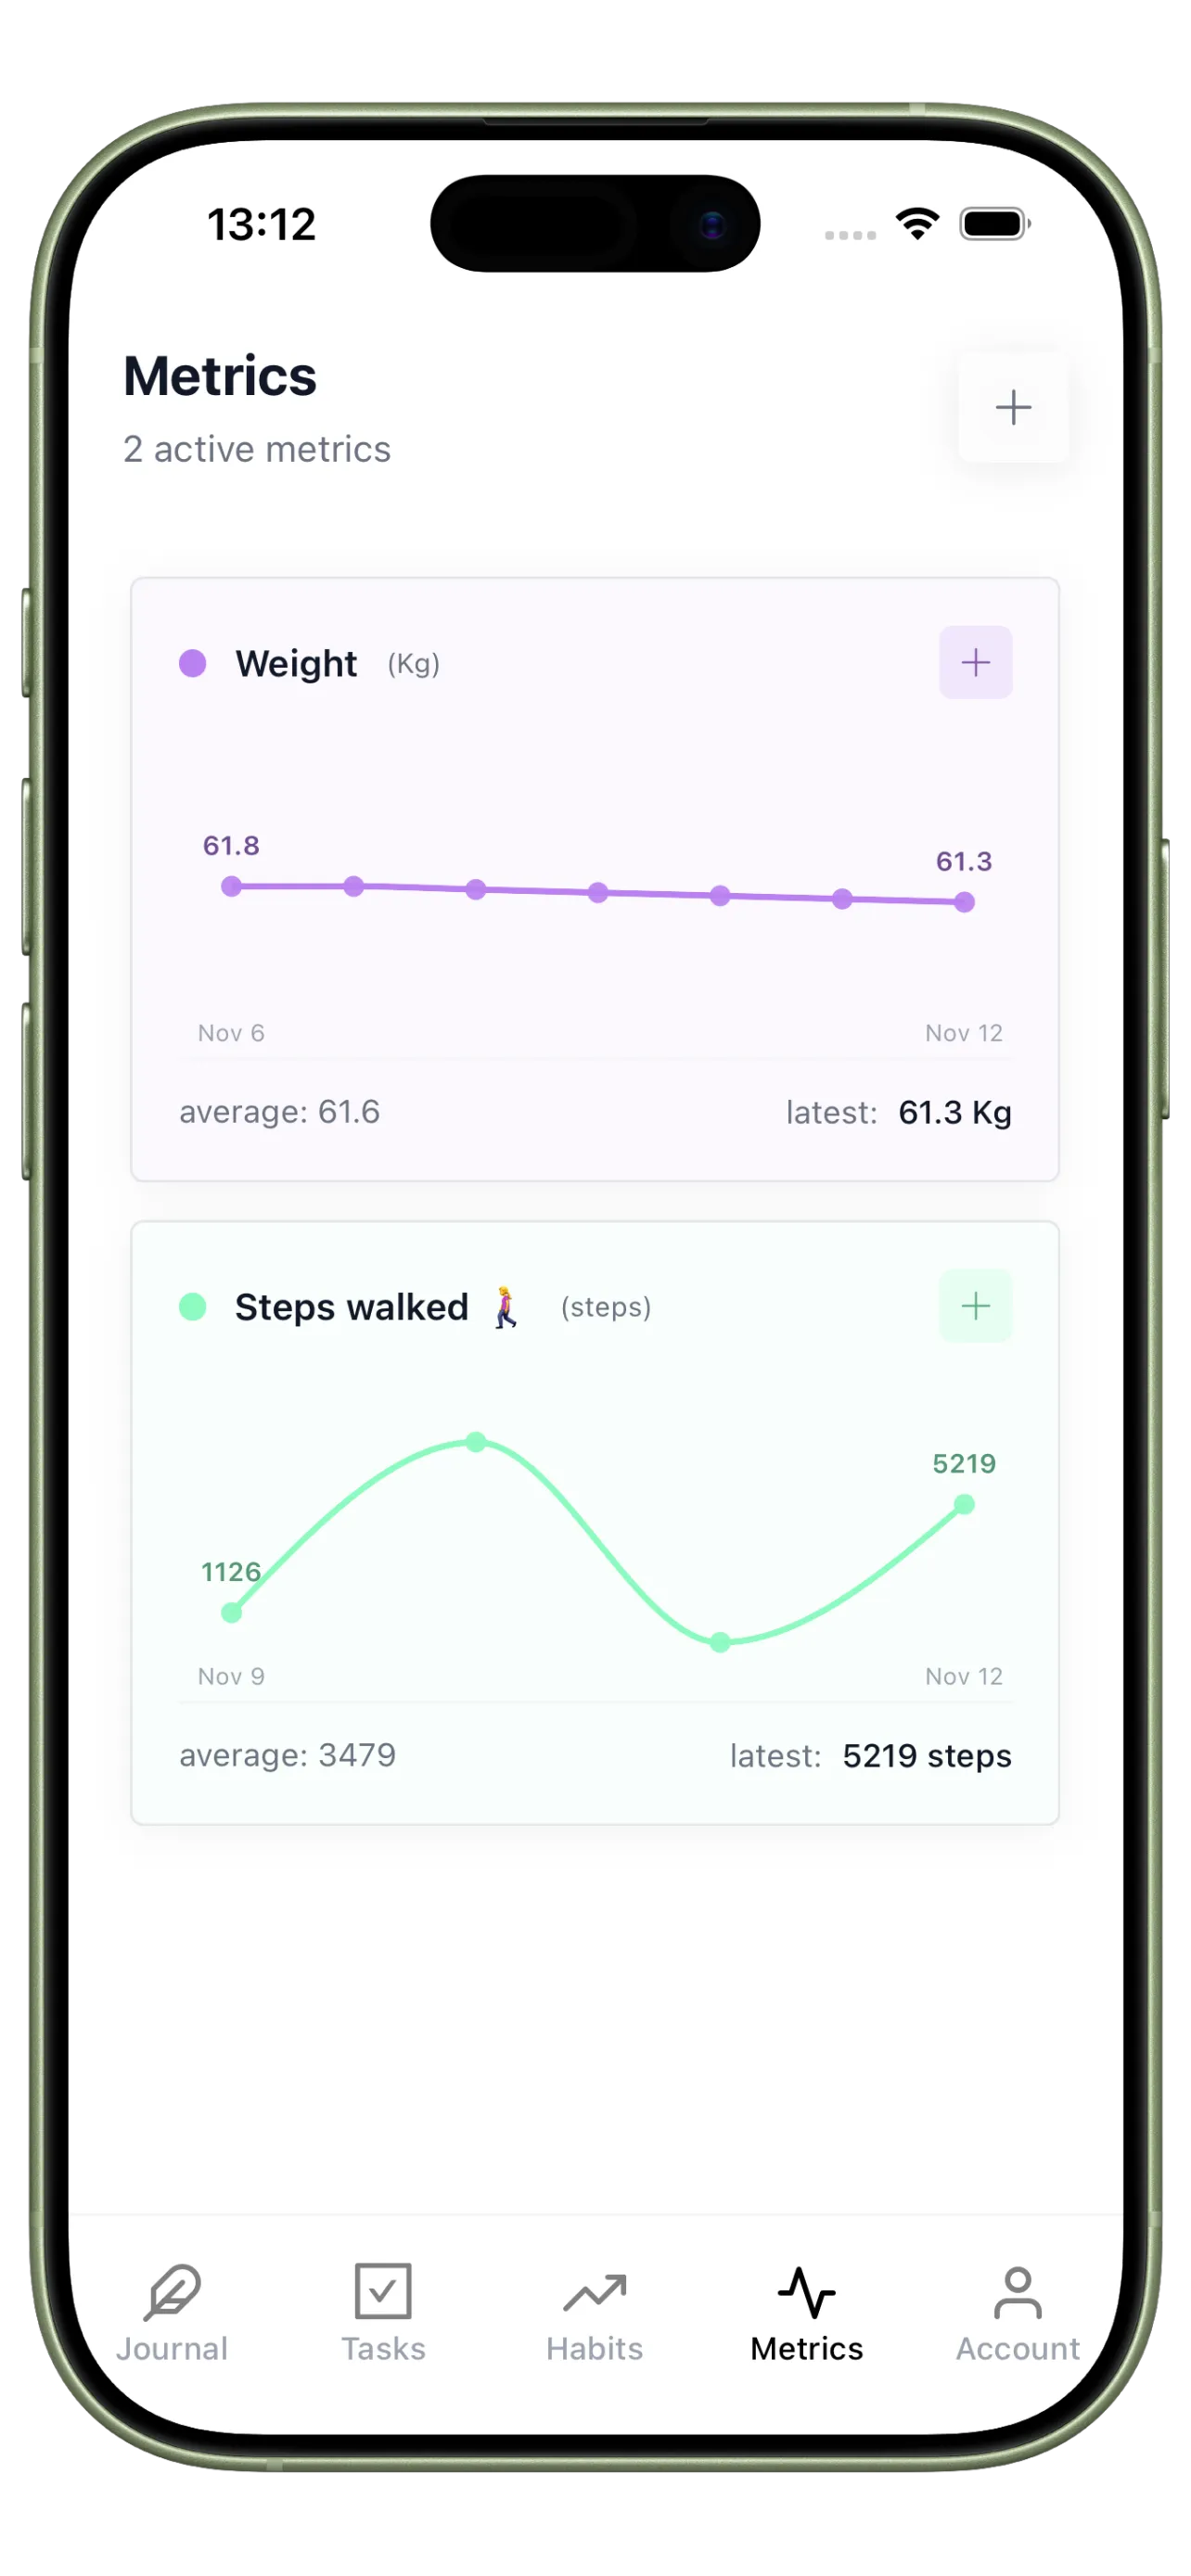
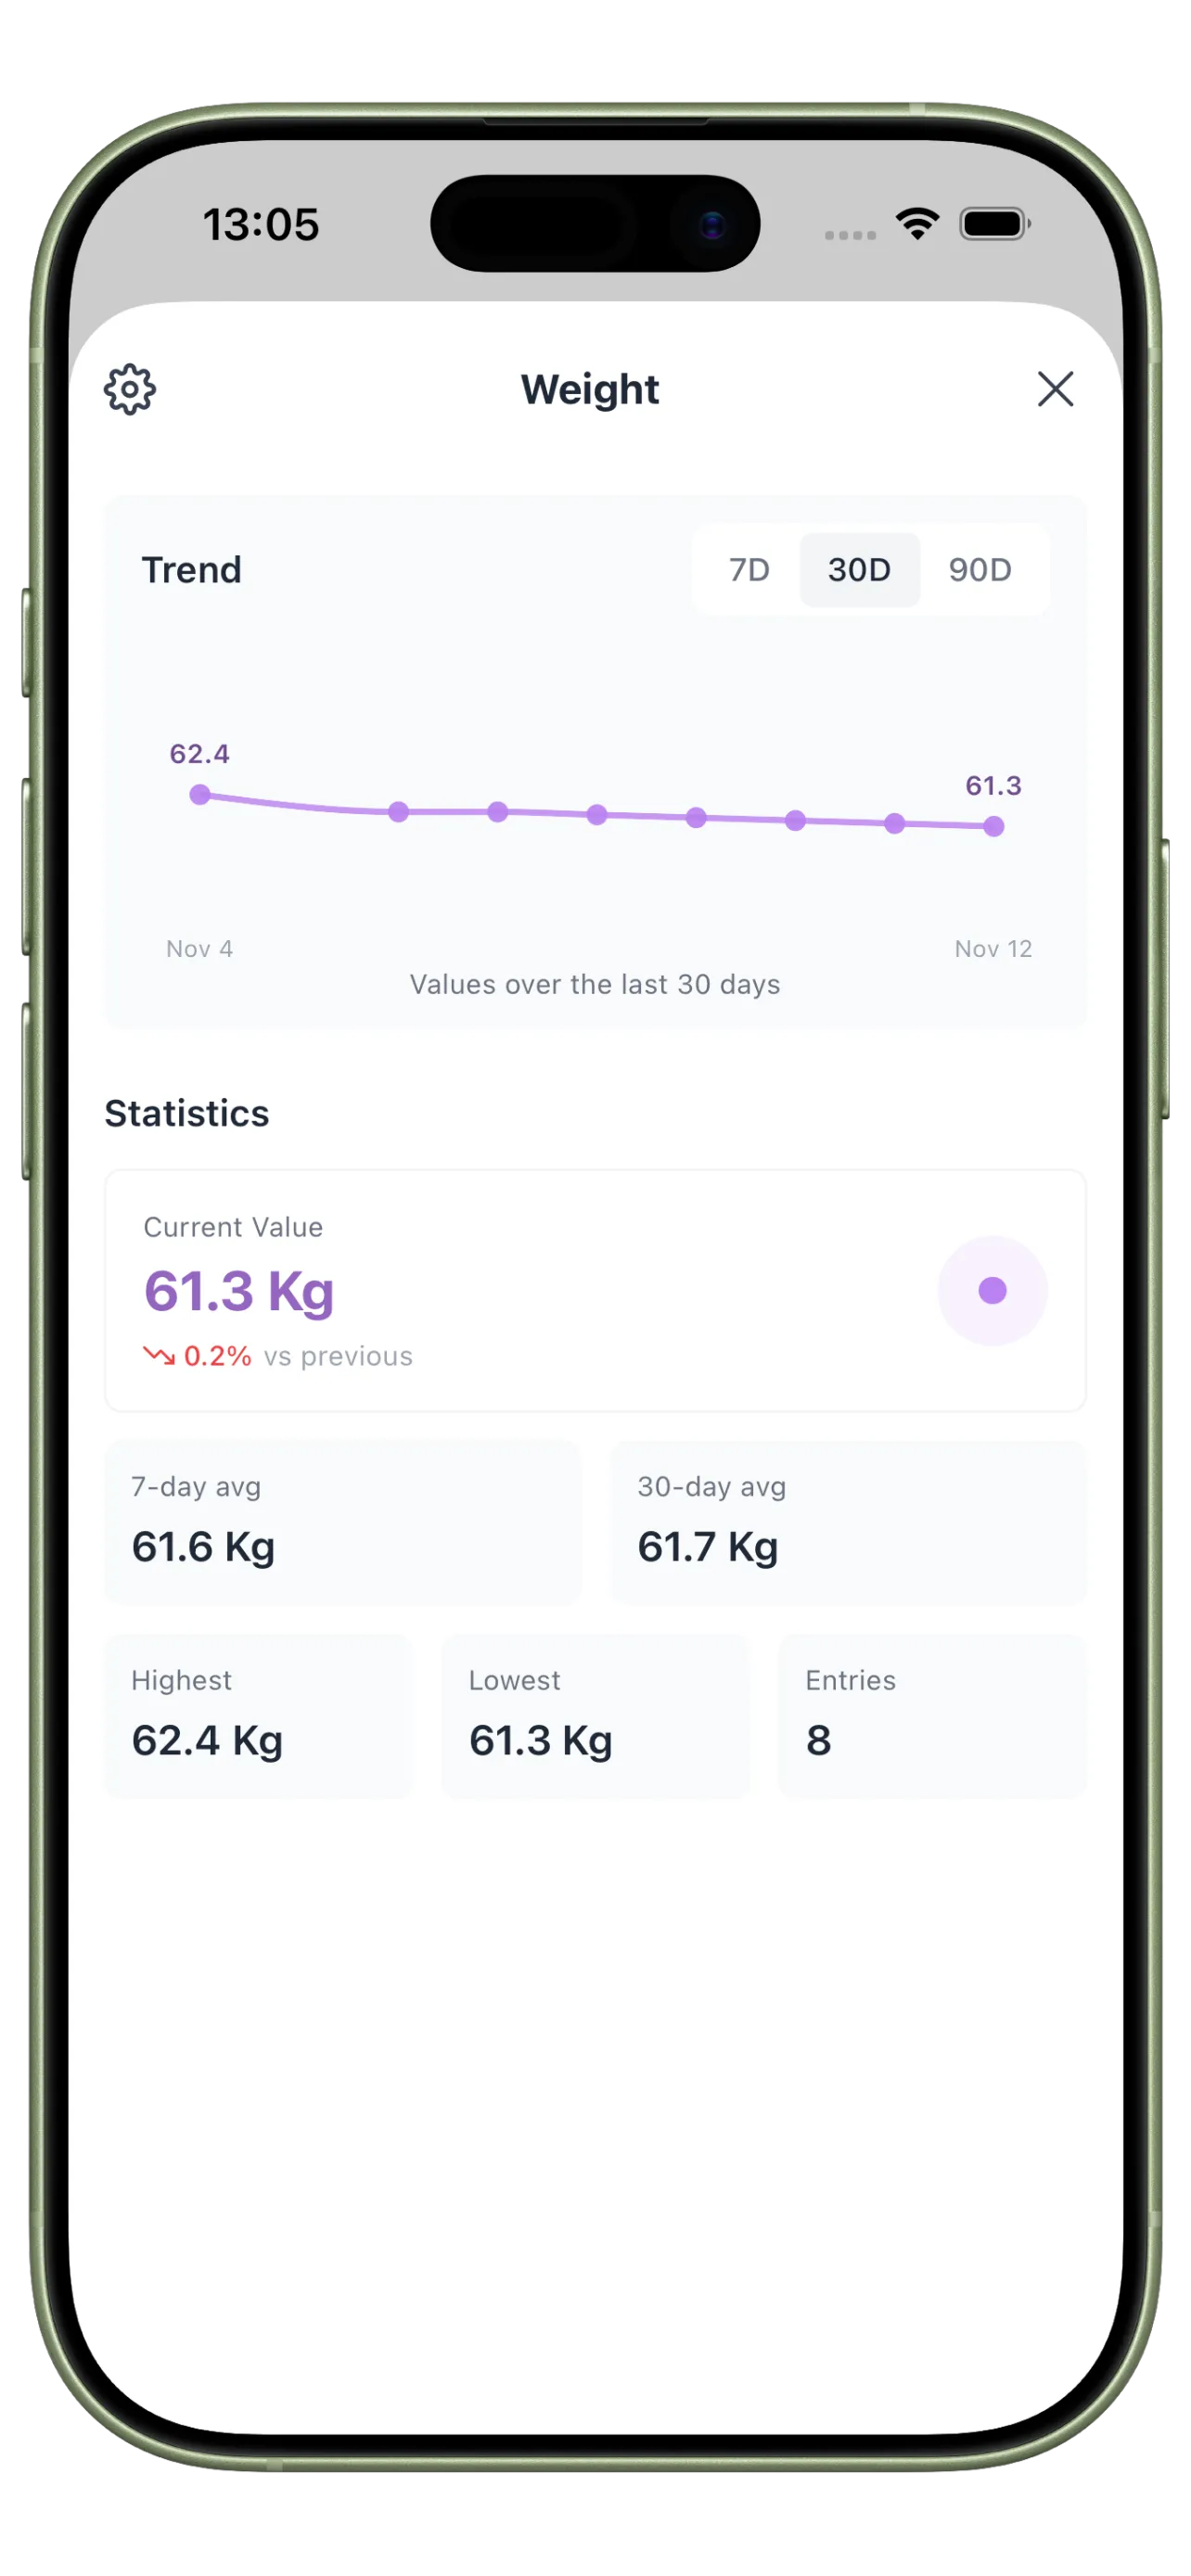
Behavior Trend Metrics
Track custom measures like focus blocks, shutdown quality, or workout completion alongside your habits.
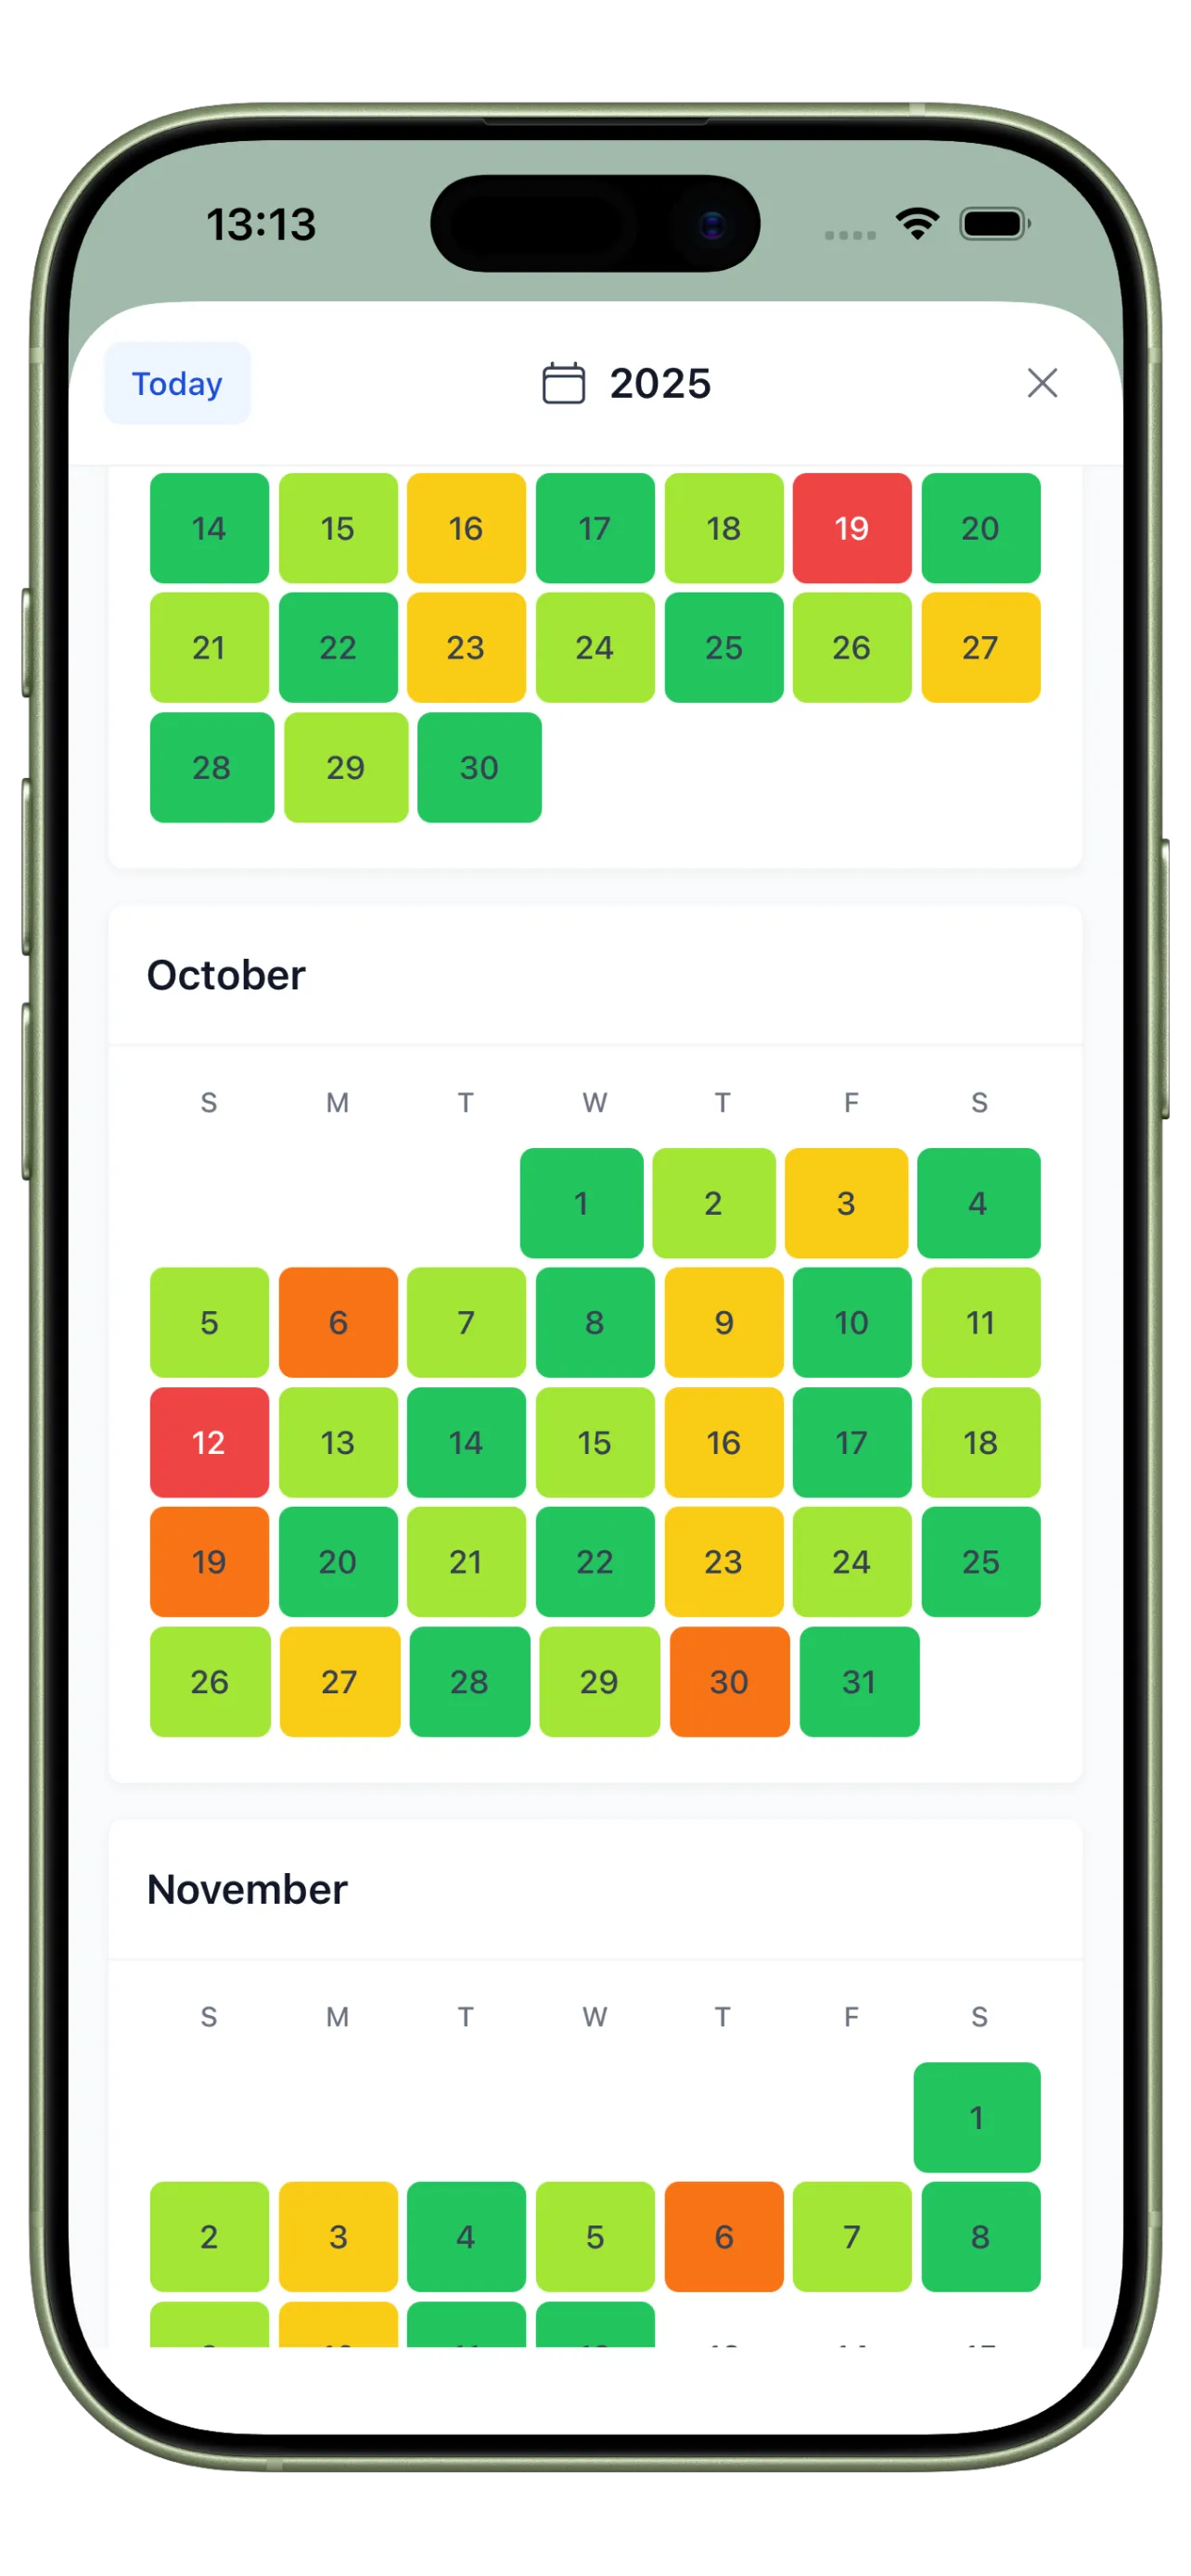
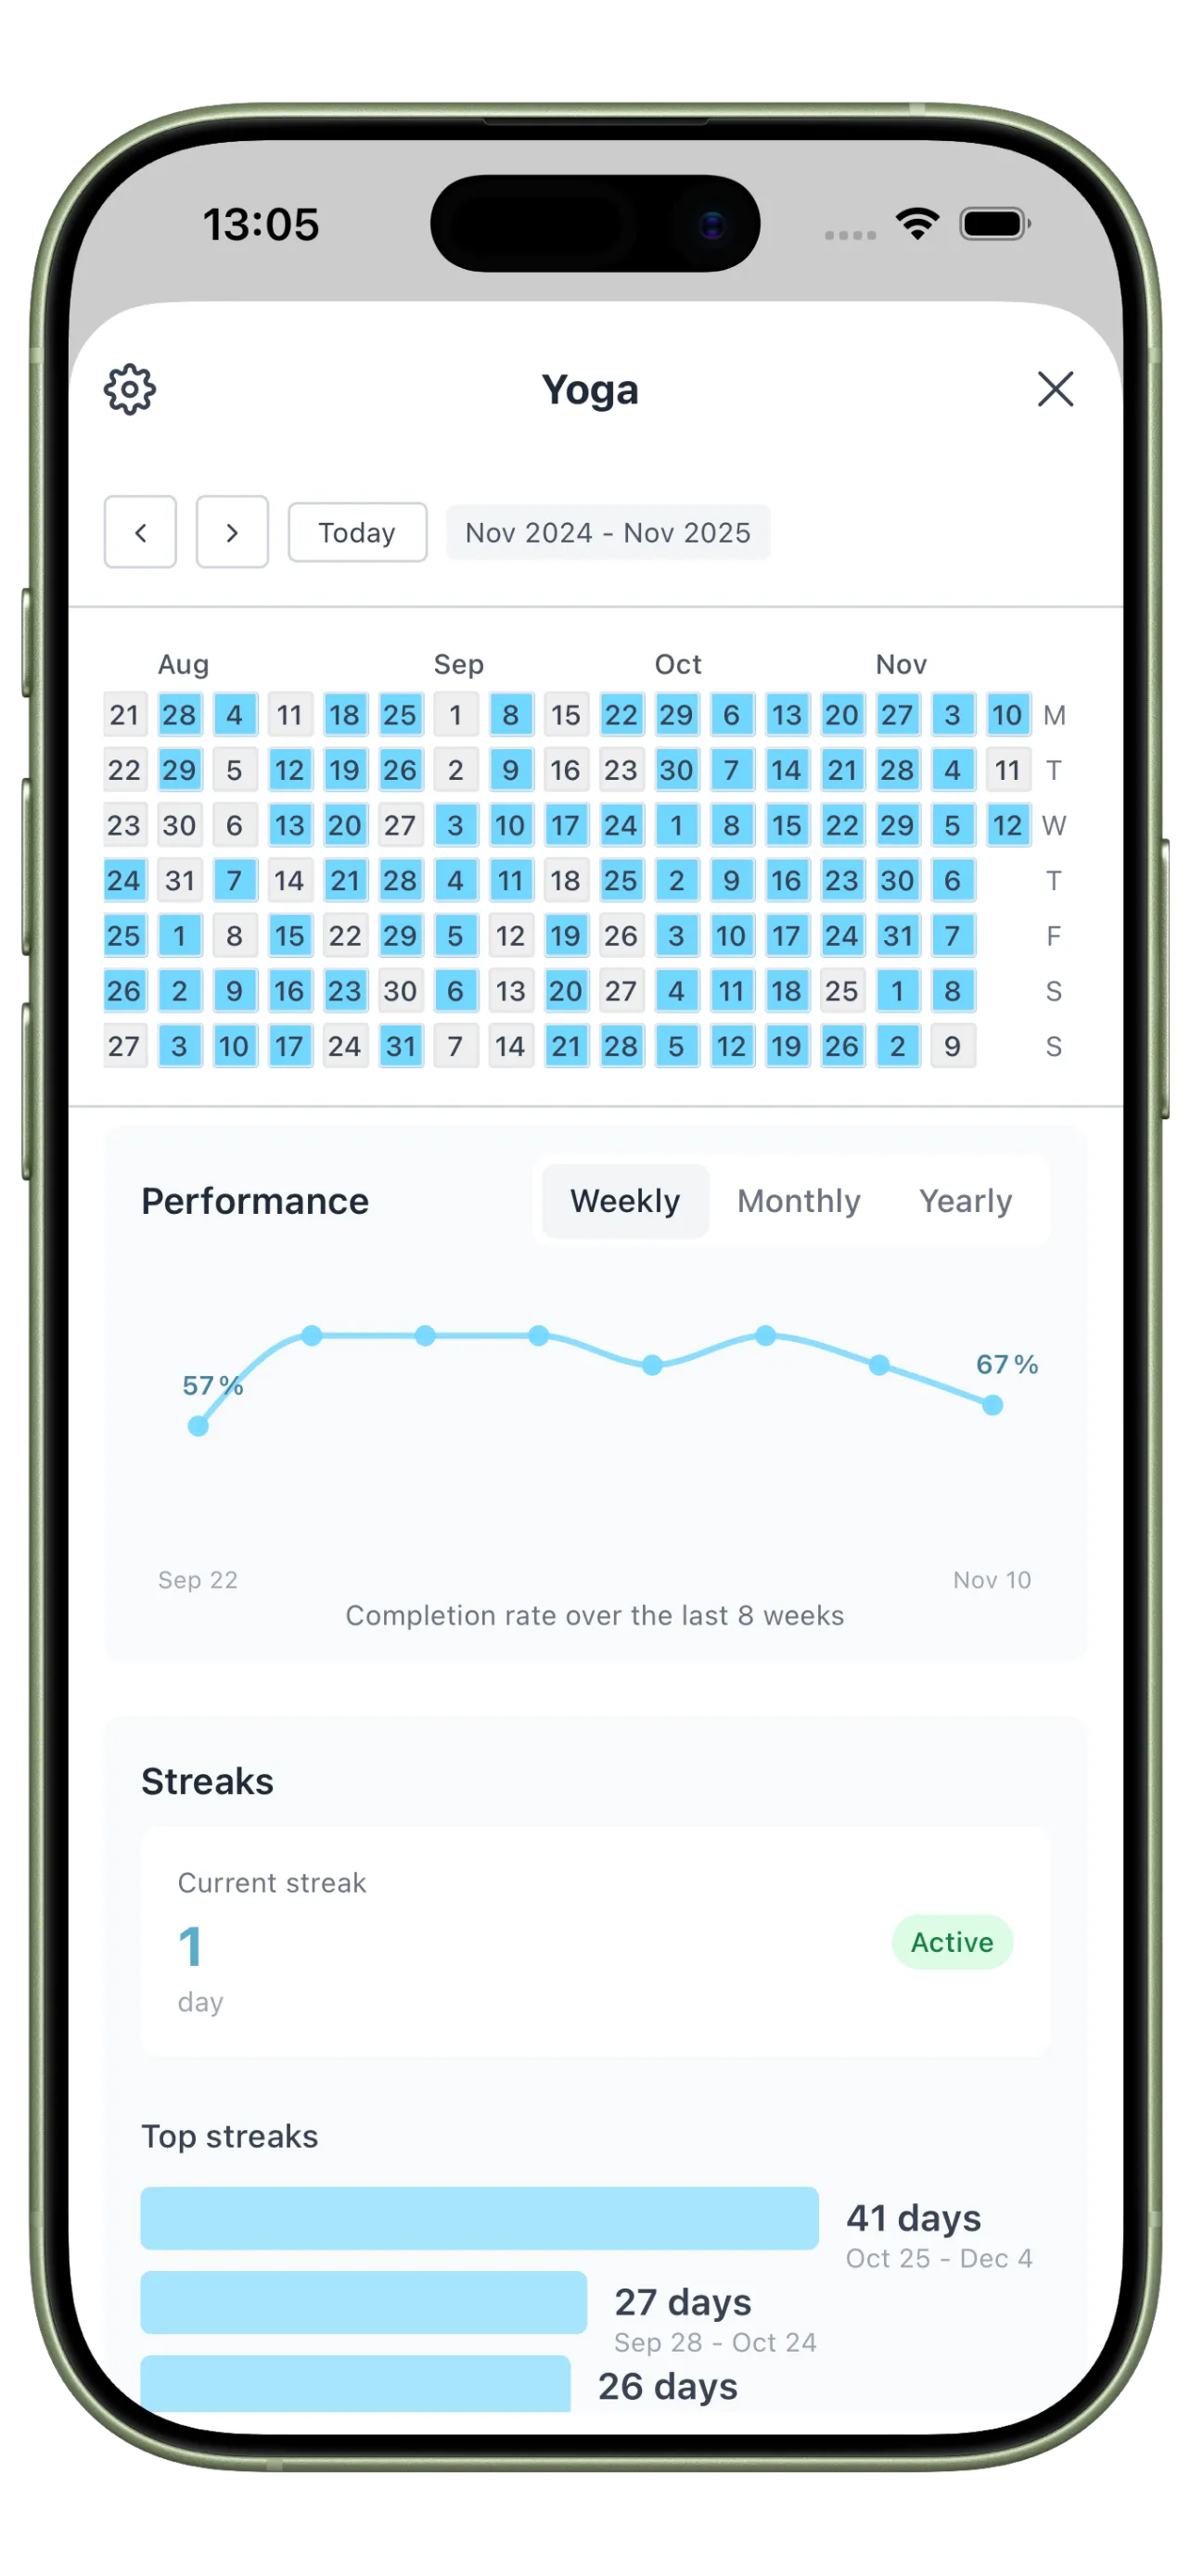
Consistency Heatmap
Use an at-a-glance calendar to spot clusters of strong days, weak days, and fast recoveries.
From Isolated Streaks to System Visibility

Before: Data Without Direction
You can see a few completed habits, but the pattern behind strong weeks and weak weeks stays hidden.

After: A Dashboard You Can Act On
You know which habits held, what the day felt like, and which routines deserve adjustment before momentum drops.
Consistency Dashboard FAQ
What should be included in a consistency dashboard?
Usually a handful of anchor habits, a short daily reflection, and one or two supporting metrics that explain whether routines are holding.
How many metrics do I need?
Start with one or two. Too many numbers make the dashboard harder to review and less useful in practice.
How is this different from a simple habit tracker?
A simple tracker records completion. A consistency dashboard adds context and trend review so you can improve the system behind the behavior.
Build a Dashboard You Will Actually Review
Consistency improves faster when your dashboard shows both the behavior and the context behind it.